Key-figures dashboard for the strategic management
Do you want to know how the current road situation, affects the execution of your projects? How does it translate into Key Performance Indicators (KPIs) in your unit or organization? Properly defining KPIs is the task of every road and track network manager and owner. They have a direct impact on the planning of activities and allow to objectively assess the results of work, its quality and costs incurred.
Heller Group created hiATLAS for efficient processing of data so that managers can further use it for individual analysis, strategy development, control, based on the KPIs of their organization.
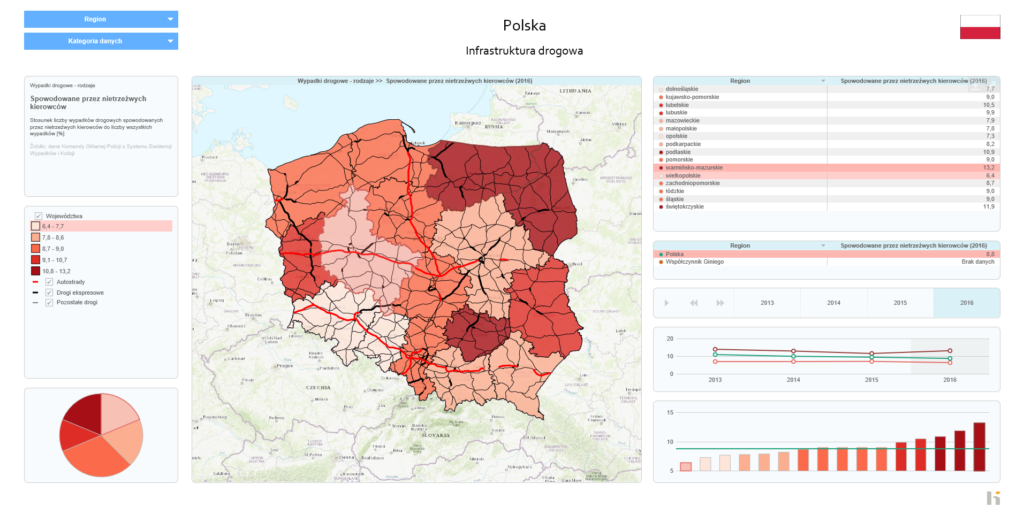
hiAtlas report - Road accidents caused by intoxicated drivers - visualization on the platform
hiATLAS provides the following benefits:
supports fast making or correcting decisions,
allows you to plan and prioritize tasks,
makes it possible to react sensibly to emerging problems,
indicates trends or regularities that are difficult to detect in daily work,
allows you to effectively compare and evaluate complex infrastructure data, import it and map it.
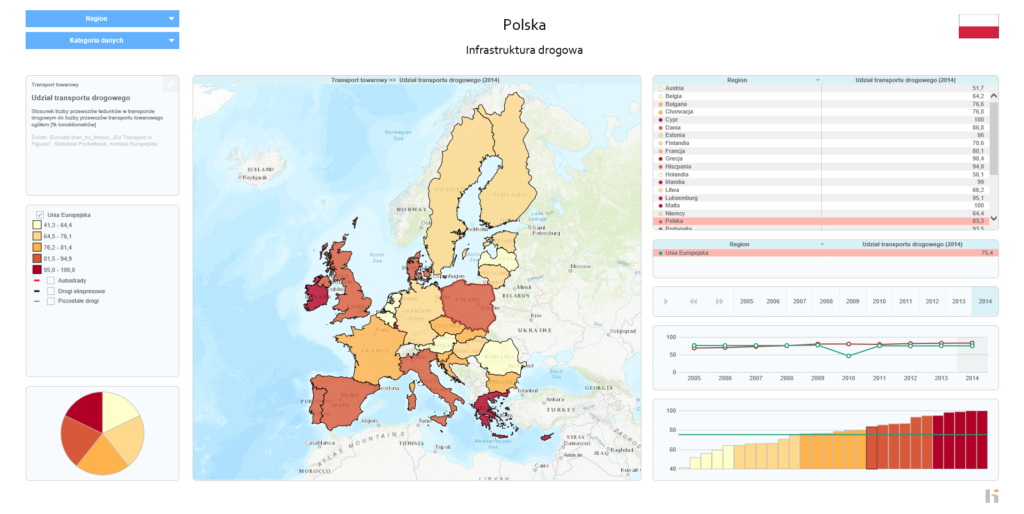
hiAtlas report - share of road transport
How does hiATLAS work?
shows the most important road information in terms of defined KPIs,
checks validity of the data,
visualizes the data of specified query within selected area (points or sections) in the form of dynamic reports or on maps, charts and tables,
graphically presents important content allowing immediate data interpretation.
hiAtlas report - Length of bicycle paths per 10,000 people [km/10,000 people].
![Długość ścieżek rowerowych na 10 tys. osób [km/10 tys. osób]](https://heller-consult.pl/wp-content/uploads/2021/06/hiatlas_sciezki_rowerowe.png "Długość ścieżek rowerowych na 10 tys. osób [km/10 tys. osób]")